
Answers - In Class Activity - Sampling
Note
This exercise authored by Todd Gureckis and Brenden Lake, and is released under the license.
In the chapter, we discussed some basic issues in sampling. In this notebook, you will explore some handy python methods for sampling and consider the implications of sampling on what you understand about some target group (i.e., what you can generalize).
Importing and using existing functions
import numpy as np
import numpy.random as npr
import pandas as pd
import seaborn as sns
Problem 0: Seeding a random number generator
When we use the computer to play with random numbers (or random samples), we aren’t actually using random numbers. Generally speaking your computer is a deterministic machine so it is unable to make truely random numbers. Intead the numbers your computer gives you are known as pseudo-random because they have many of the properties we want from random numbers but are not exactly and entirely random.
Anytime we use random numbers in a script, simulation, or analysis it is important to “seed” the random number generator. This initialized the random number generator function to a particularly “state” and this makes the number in the script random but repeatable.
Let’s experiment with this. First try running the following cell and seeing what the output is. Try running it multiple times and seeing how the numbers change.
npr.randint(0,10,10)
array([5, 7, 6, 8, 4, 3, 6, 9, 9, 8])
Now run this cell:
npr.seed(10)
print(npr.randint(0,10,10))
print(npr.randint(0,10,10))
[9 4 0 1 9 0 1 8 9 0]
[8 6 4 3 0 4 6 8 1 8]
Again, try repeating the cell execution over and over. What do you observe?
Try restarting the kernel and run the cell again. What do you notice? Compare to other people in your group. Also change the argument to npr.seed() and see what happens.
Answer 0 here:
## Enter solution here
npr.seed(9)
print(npr.randint(0,10,10))
print(npr.randint(0,10,10))
[5 6 8 6 1 6 4 8 1 8]
[5 1 0 8 8 8 2 6 8 1]
Bottom line: Always seed the random number generator at the start of any script that uses random numbers so your code is more repeatable.
Problem 1: Sampling from a finite population
Imagine I create a list with 100 randomly determined values as below. Using the web, research the the numpy random choice() function. Use it generate a random sample of size 10 from this data. Do it twice, once with replacement and once without replacement.
my_data = np.array([75, 25, 59, 63, 48, 29,  3, 17, 68, 39,  9, 62, 61, 52, 64, 45, 90,
       87,  0, 42, 26, 52, 22, 25, 20, 22, 81, 25, 48, 79, 37,  6, 33, 30,
       81,  5, 37, 85, 65,  0, 27, 40, 96, 67, 77, 29, 32, 25,  4, 53, 46,
        7, 51, 65, 46, 91, 60, 52, 93, 26,  2, 42, 18, 19, 97, 45, 78, 33,
       25, 30, 97, 96, 99, 32, 86, 43, 81, 83, 51, 81, 36, 29,  2, 33, 95,
       39, 79,  1, 80, 17, 50, 38,  1, 98, 30, 89, 93, 27, 43, 30])
Answer 1 here:
## Enter solution here
print(npr.choice(my_data,size=10,replace=True))
print(npr.choice(my_data,size=10,replace=False))
[60 30 62 85 42 39 36 60 53 19]
[52 25 43 45 30  1 68  7 81 81]
Problem 2: Sampling from a data frame
Sometimes what we are interested in is sampling from a pandas dataframe rather than a list or numpy array. Why might we want to sample from a dataset? One is to randomly select a subset of the data, for a training vs. test split, if we are doing machine learning projects on the data (we’ll talk about this later). Another is if there are too many records to analyze so it makes sense to randomly select a subset and analyze those. Another is to repeatedly sample over and over again from a dataset to do a statistical method called “boostrapping” (https://en.wikipedia.org/wiki/Bootstrapping_(statistics))
This code loads an example pandas dataset of different penguins.
penguins_df = sns.load_dataset('penguins')
penguins_df.head()
| species | island | bill_length_mm | bill_depth_mm | flipper_length_mm | body_mass_g | sex | |
|---|---|---|---|---|---|---|---|
| 0 | Adelie | Torgersen | 39.1 | 18.7 | 181.0 | 3750.0 | Male |
| 1 | Adelie | Torgersen | 39.5 | 17.4 | 186.0 | 3800.0 | Female |
| 2 | Adelie | Torgersen | 40.3 | 18.0 | 195.0 | 3250.0 | Female |
| 3 | Adelie | Torgersen | NaN | NaN | NaN | NaN | NaN |
| 4 | Adelie | Torgersen | 36.7 | 19.3 | 193.0 | 3450.0 | Female |
penguins_df.info()
<class 'pandas.core.frame.DataFrame'>
RangeIndex: 344 entries, 0 to 343
Data columns (total 7 columns):
 #   Column             Non-Null Count  Dtype
---  ------             --------------  -----
 0   species            344 non-null    object
 1   island             344 non-null    object
 2   bill_length_mm     342 non-null    float64
 3   bill_depth_mm      342 non-null    float64
 4   flipper_length_mm  342 non-null    float64
 5   body_mass_g        342 non-null    float64
 6   sex                333 non-null    object
dtypes: float64(4), object(3)
memory usage: 18.9+ KB
Research the pandas sample() method and randomly sample 20 penguins from the dataframe.
Answer 2a here:
## Enter solution here
penguins_df.sample(n=20)
| species | island | bill_length_mm | bill_depth_mm | flipper_length_mm | body_mass_g | sex | |
|---|---|---|---|---|---|---|---|
| 329 | Gentoo | Biscoe | 48.1 | 15.1 | 209.0 | 5500.0 | Male |
| 190 | Chinstrap | Dream | 46.9 | 16.6 | 192.0 | 2700.0 | Female |
| 207 | Chinstrap | Dream | 52.2 | 18.8 | 197.0 | 3450.0 | Male |
| 255 | Gentoo | Biscoe | 48.4 | 16.3 | 220.0 | 5400.0 | Male |
| 268 | Gentoo | Biscoe | 44.9 | 13.3 | 213.0 | 5100.0 | Female |
| 224 | Gentoo | Biscoe | 47.6 | 14.5 | 215.0 | 5400.0 | Male |
| 138 | Adelie | Dream | 37.0 | 16.5 | 185.0 | 3400.0 | Female |
| 2 | Adelie | Torgersen | 40.3 | 18.0 | 195.0 | 3250.0 | Female |
| 271 | Gentoo | Biscoe | 48.5 | 14.1 | 220.0 | 5300.0 | Male |
| 342 | Gentoo | Biscoe | 45.2 | 14.8 | 212.0 | 5200.0 | Female |
| 60 | Adelie | Biscoe | 35.7 | 16.9 | 185.0 | 3150.0 | Female |
| 322 | Gentoo | Biscoe | 47.2 | 15.5 | 215.0 | 4975.0 | Female |
| 185 | Chinstrap | Dream | 51.0 | 18.8 | 203.0 | 4100.0 | Male |
| 122 | Adelie | Torgersen | 40.2 | 17.0 | 176.0 | 3450.0 | Female |
| 279 | Gentoo | Biscoe | 50.4 | 15.3 | 224.0 | 5550.0 | Male |
| 267 | Gentoo | Biscoe | 50.5 | 15.9 | 225.0 | 5400.0 | Male |
| 334 | Gentoo | Biscoe | 46.2 | 14.1 | 217.0 | 4375.0 | Female |
| 57 | Adelie | Biscoe | 40.6 | 18.8 | 193.0 | 3800.0 | Male |
| 106 | Adelie | Biscoe | 38.6 | 17.2 | 199.0 | 3750.0 | Female |
| 311 | Gentoo | Biscoe | 52.2 | 17.1 | 228.0 | 5400.0 | Male |
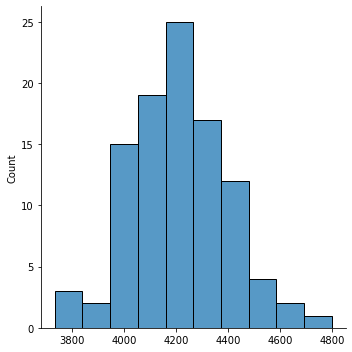
Now, for part b of this question, in a for loop, 100 times create a random sample of the dataframe and compute the mean body mass of the penguins in your sample. Append all these values to a list and then plot a histogram of these values (using sns.displot). Compare it to the mean of the dataset containing all the penguins.
Answer 2b here:
## Enter solution here
overall_mean = penguins_df['body_mass_g'].mean()

list_sample_mean = []
for i in range(100):
    sample_mean = penguins_df.sample(n=20)['body_mass_g'].mean()
    list_sample_mean.append(sample_mean)

sns.displot(list_sample_mean)
print("Overall mean is ", overall_mean)
Overall mean is 4201.754385964912
Problem 3: Stratified sampling
One problem with the simple random samples we made of the penguins is that in each sample we might exclude some important groups of the data. For example, if we only sampled 10 penguins perhaps all of them are male. If we wanted to be more even handed name make sure our samples were representative of the sex differences then we might want to sample from the subpopulations. This is called “stratified sampling”.
Please read this example webpage: https://www.statology.org/stratified-sampling-pandas/ on stratified sampling and adapt the code to generate a random sample of 10 penguins that is stratified so that there are 5 male and 5 female examples in the sample
Problem 3: Answer here
## Enter solution here
penguins_df.groupby('sex').sample(5)
| species | island | bill_length_mm | bill_depth_mm | flipper_length_mm | body_mass_g | sex | |
|---|---|---|---|---|---|---|---|
| 184 | Chinstrap | Dream | 42.5 | 16.7 | 187.0 | 3350.0 | Female |
| 16 | Adelie | Torgersen | 38.7 | 19.0 | 195.0 | 3450.0 | Female |
| 104 | Adelie | Biscoe | 37.9 | 18.6 | 193.0 | 2925.0 | Female |
| 64 | Adelie | Biscoe | 36.4 | 17.1 | 184.0 | 2850.0 | Female |
| 27 | Adelie | Biscoe | 40.5 | 17.9 | 187.0 | 3200.0 | Female |
| 168 | Chinstrap | Dream | 50.3 | 20.0 | 197.0 | 3300.0 | Male |
| 179 | Chinstrap | Dream | 49.5 | 19.0 | 200.0 | 3800.0 | Male |
| 123 | Adelie | Torgersen | 41.4 | 18.5 | 202.0 | 3875.0 | Male |
| 101 | Adelie | Biscoe | 41.0 | 20.0 | 203.0 | 4725.0 | Male |
| 194 | Chinstrap | Dream | 50.9 | 19.1 | 196.0 | 3550.0 | Male |