ODE_Maple.mw
ODE Fall 2012, A. Donev, CIMS
Using the symbolic algebra package Maple to solve ODEs analytically and numerically
| > |
ODE := diff(theta(t),t,t) + gamma*diff(theta(t),t) + omega^2*sin(theta(t))=0; # Equations |
 |
(1) |
| > |
ICs := theta(0)=Theta, D(theta)(0)=Omega; # Initial conditions |
 |
(2) |
| > |
dsolve({ODE, ICs}, theta(t)); # Try to compute closed-form solution (no answer is returned) |
1. Linearized ODE
The linearized ODE in which sin(theta) is replaced by theta can be solved analytically using the methods we discussed in class.
Maple knows all of the recipies we discussed and can do the calculations without making mistakes:
| > |
LinearODE := diff(theta(t),t,t) + gamma*diff(theta(t),t) + omega^2*theta(t)=0; # Linearization for small theta |
 |
(3) |
| > |
solution:=simplify(dsolve({LinearODE, ICs}, theta(t))); |
Now let's plug in some specific numbers for which complex numbers will be required:
| > |
numbers:={gamma=1, omega=sqrt(5/4), Theta=Pi/4, Omega=2}; |
 |
(5) |
Plug these numbers into the solution:
| > |
eval(solution,numbers); |

 |
(6) |
By default Maple does not perform complex number simplifications, we need to use the evalc (evaluate using complex arithmetic) function, and then simplify:
| > |
approx_solution:=simplify(evalc(eval(solution,numbers))); |
 |
(7) |
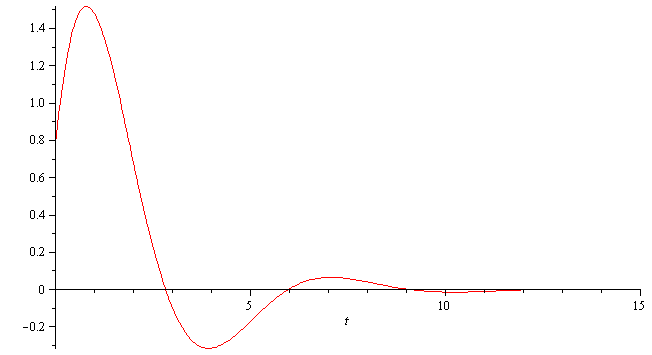
Let us now plot the approximate (linearized) solution theta(t):
| > |
p1:=plot(eval(theta(t),approx_solution), t=0..15, color=red): |
2. Phase Plot
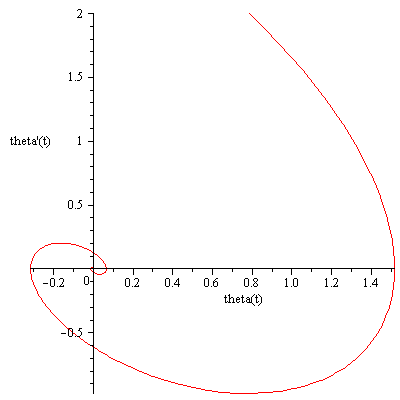
Let us now plot the trajectory in phase space, where the coordinates are [theta(t), theta'(t)]
| > |
y1:=eval(theta(t),approx_solution); # Position (angle) of pendulum theta(t) |
 |
(8) |
| > |
y2:=simplify(eval(diff(theta(t),t), approx_solution)); # Velocity of pendulum theta'(t) |
 |
(9) |
| > |
P1:=plot([y1, y2, t=0..15], color='red', labels=["theta(t)","theta'(t)"]): |
3. Numerical Solution
Finally, let's solve the true nonlinear ODE numerically using Maple's default numerical method (called "RK4")
| > |
num_solution:=dsolve(eval({ODE, ICs}, numbers), theta(t), type='numeric', range=0..15); |
 |
(10) |
| > |
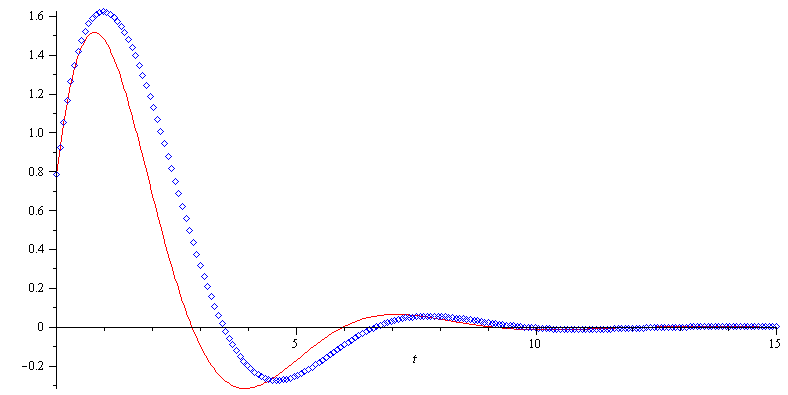
p2:=odeplot(num_solution, color='blue', style='point'): |
Let's compare the numerical solution to the approximate (linearized) solution:
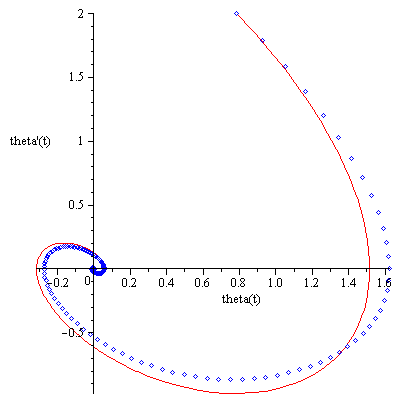
And let's also compare the true phase plot to the approximate one:
| > |
P2:=odeplot(num_solution, [theta(t), diff(theta(t), t)], color='blue', style='point'): |


